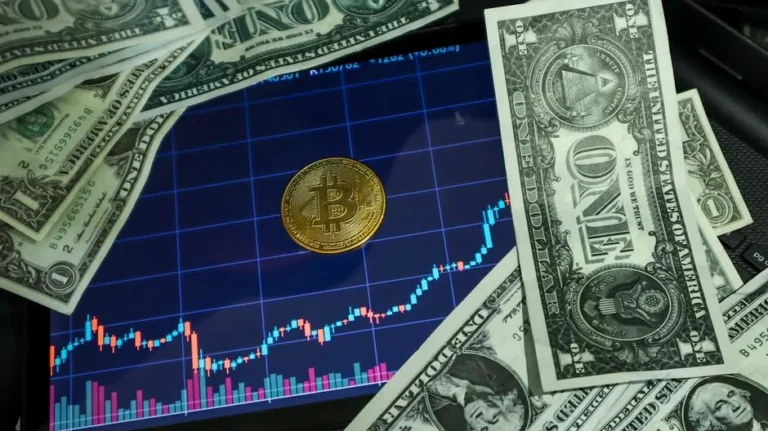
Bitcoin moved back above $69,000 as reports of US-Iran ceasefire talks reduced immediate war-risk pricing, but the sharper message came from derivatives rather than from any clean “safe haven” bid. The rally fits a market still trading geopolitical headlines as risk-on or risk-off inputs, with short liquidations and rising futures interest doing much of the near-term work.
The sequence that pushed Bitcoin off the lows
Since the conflict began, Bitcoin has mostly stayed inside a broad $65,000 to $73,000 range, falling as tensions escalated and then recovering when a diplomatic framework appeared. The latest move started with reports of a proposed two-stage deal: an initial 45-day pause, followed by efforts to negotiate a permanent peace agreement.
That framework matters because it is tied to concrete dispute points, not just rhetoric. Negotiators are reportedly focused on reopening the Strait of Hormuz and addressing Iran’s uranium stockpile, and the market read that as a possible reduction in immediate regional disruption. Bitcoin climbed from the mid-$66,000s to above $69,500 on the reports and briefly traded over $72,000 after President Trump announced a two-week pause in military escalation.
Why this looked like a squeeze before it looked like conviction
Nearly $200 million in Bitcoin short positions were liquidated during the ceasefire-driven rally, a sign that forced covering accelerated the move once price started rising. At the same time, futures open interest increased by roughly 3% to 5% on major venues including CME and Binance, showing traders were adding exposure rather than simply closing positions into relief.

That combination is important for market structure. A headline can start the move, but when open interest rises alongside liquidations, price can overshoot because both new positioning and forced exits are hitting the tape together. In that setup, a rally says less about a stable reassessment of Bitcoin’s long-term value and more about how quickly macro-sensitive positioning can unwind when the probability of a worse outcome temporarily drops.
Oil, Hormuz, and why Bitcoin is trading with risk sentiment
The reopening of the Strait of Hormuz is central because it changes the path for oil, and oil changes the tone for everything else. As ceasefire talks gained attention, crude retreated from recent highs because a reopened shipping route would reduce supply fears and ease one of the clearest channels through which the conflict was hitting global markets.
That is why it is misleading to treat Bitcoin here as insulated from geopolitical stress. Its recent behavior looks closer to a fast-reacting barometer of cross-market risk appetite: tensions rise, oil risk rises, broader sentiment deteriorates, and Bitcoin weakens; ceasefire odds improve, oil pressure cools, and crypto catches a relief bid. Altcoins such as Ethereum, XRP, Solana, and Dogecoin also advanced, mostly in the 2% to 5% range, which reinforces the read that this was broad risk re-engagement rather than a narrow flight to safety.
The price map is clear even if the politics are not
For now, the trading range is doing a better job than the narrative. Bitcoin has been boxed between roughly $65,000 and $73,000 since the conflict started, with resistance near $71,500 and then around $75,000, while longer-term support remains helped by the 200-week EMA.
| Checkpoint | Why it matters | Market implication |
|---|---|---|
| $65,000 to $73,000 range | Defines the conflict-era trading box | Headlines may move price sharply, but the broader regime is still consolidation |
| $71,500 resistance | Near-term ceiling tested during relief rallies | Failure here suggests squeeze exhaustion rather than trend change |
| $75,000 resistance | Higher breakout threshold beyond the current range | Would likely require firmer ceasefire confirmation and sustained risk-on flows |
| April 7 deadline | Political timing risk tied to Trump’s public deadlines and threats | Potential volatility spike if the 45-day pause is confirmed, delayed, or breaks down |
The practical constraint is that politics remain less stable than the chart. Trump’s shifting deadlines and repeated threats against Iranian energy infrastructure make the market hesitant to treat the proposed 45-day pause as durable before formal confirmation. As long as that uncertainty remains, traders should be careful about reading every upside move as a clean macro breakout instead of a range move amplified by leverage.
The next test is not the headline alone but whether the pause becomes tradeable fact
The next obvious checkpoint is the April 7 ceasefire deadline and any follow-through that confirms or undermines the proposed 45-day pause. If negotiations hold and the Hormuz issue starts moving toward implementation, Bitcoin has a better chance of pressing resistance with broader risk assets; if talks stall or threats return, the same sensitivity that fueled the rebound can reverse quickly.
Quick reader checks
Is this a safe-haven move? Not in a pure sense. Recent price action suggests Bitcoin is reacting with broader risk sentiment, not standing apart from it.
What would make the rally look more durable? Confirmation of the 45-day pause, calmer oil markets, and a move through resistance that is not driven mainly by liquidations.
What is the main warning sign? Rising volatility around political deadlines without clear diplomatic follow-through, especially if open interest keeps building into uncertain news flow.